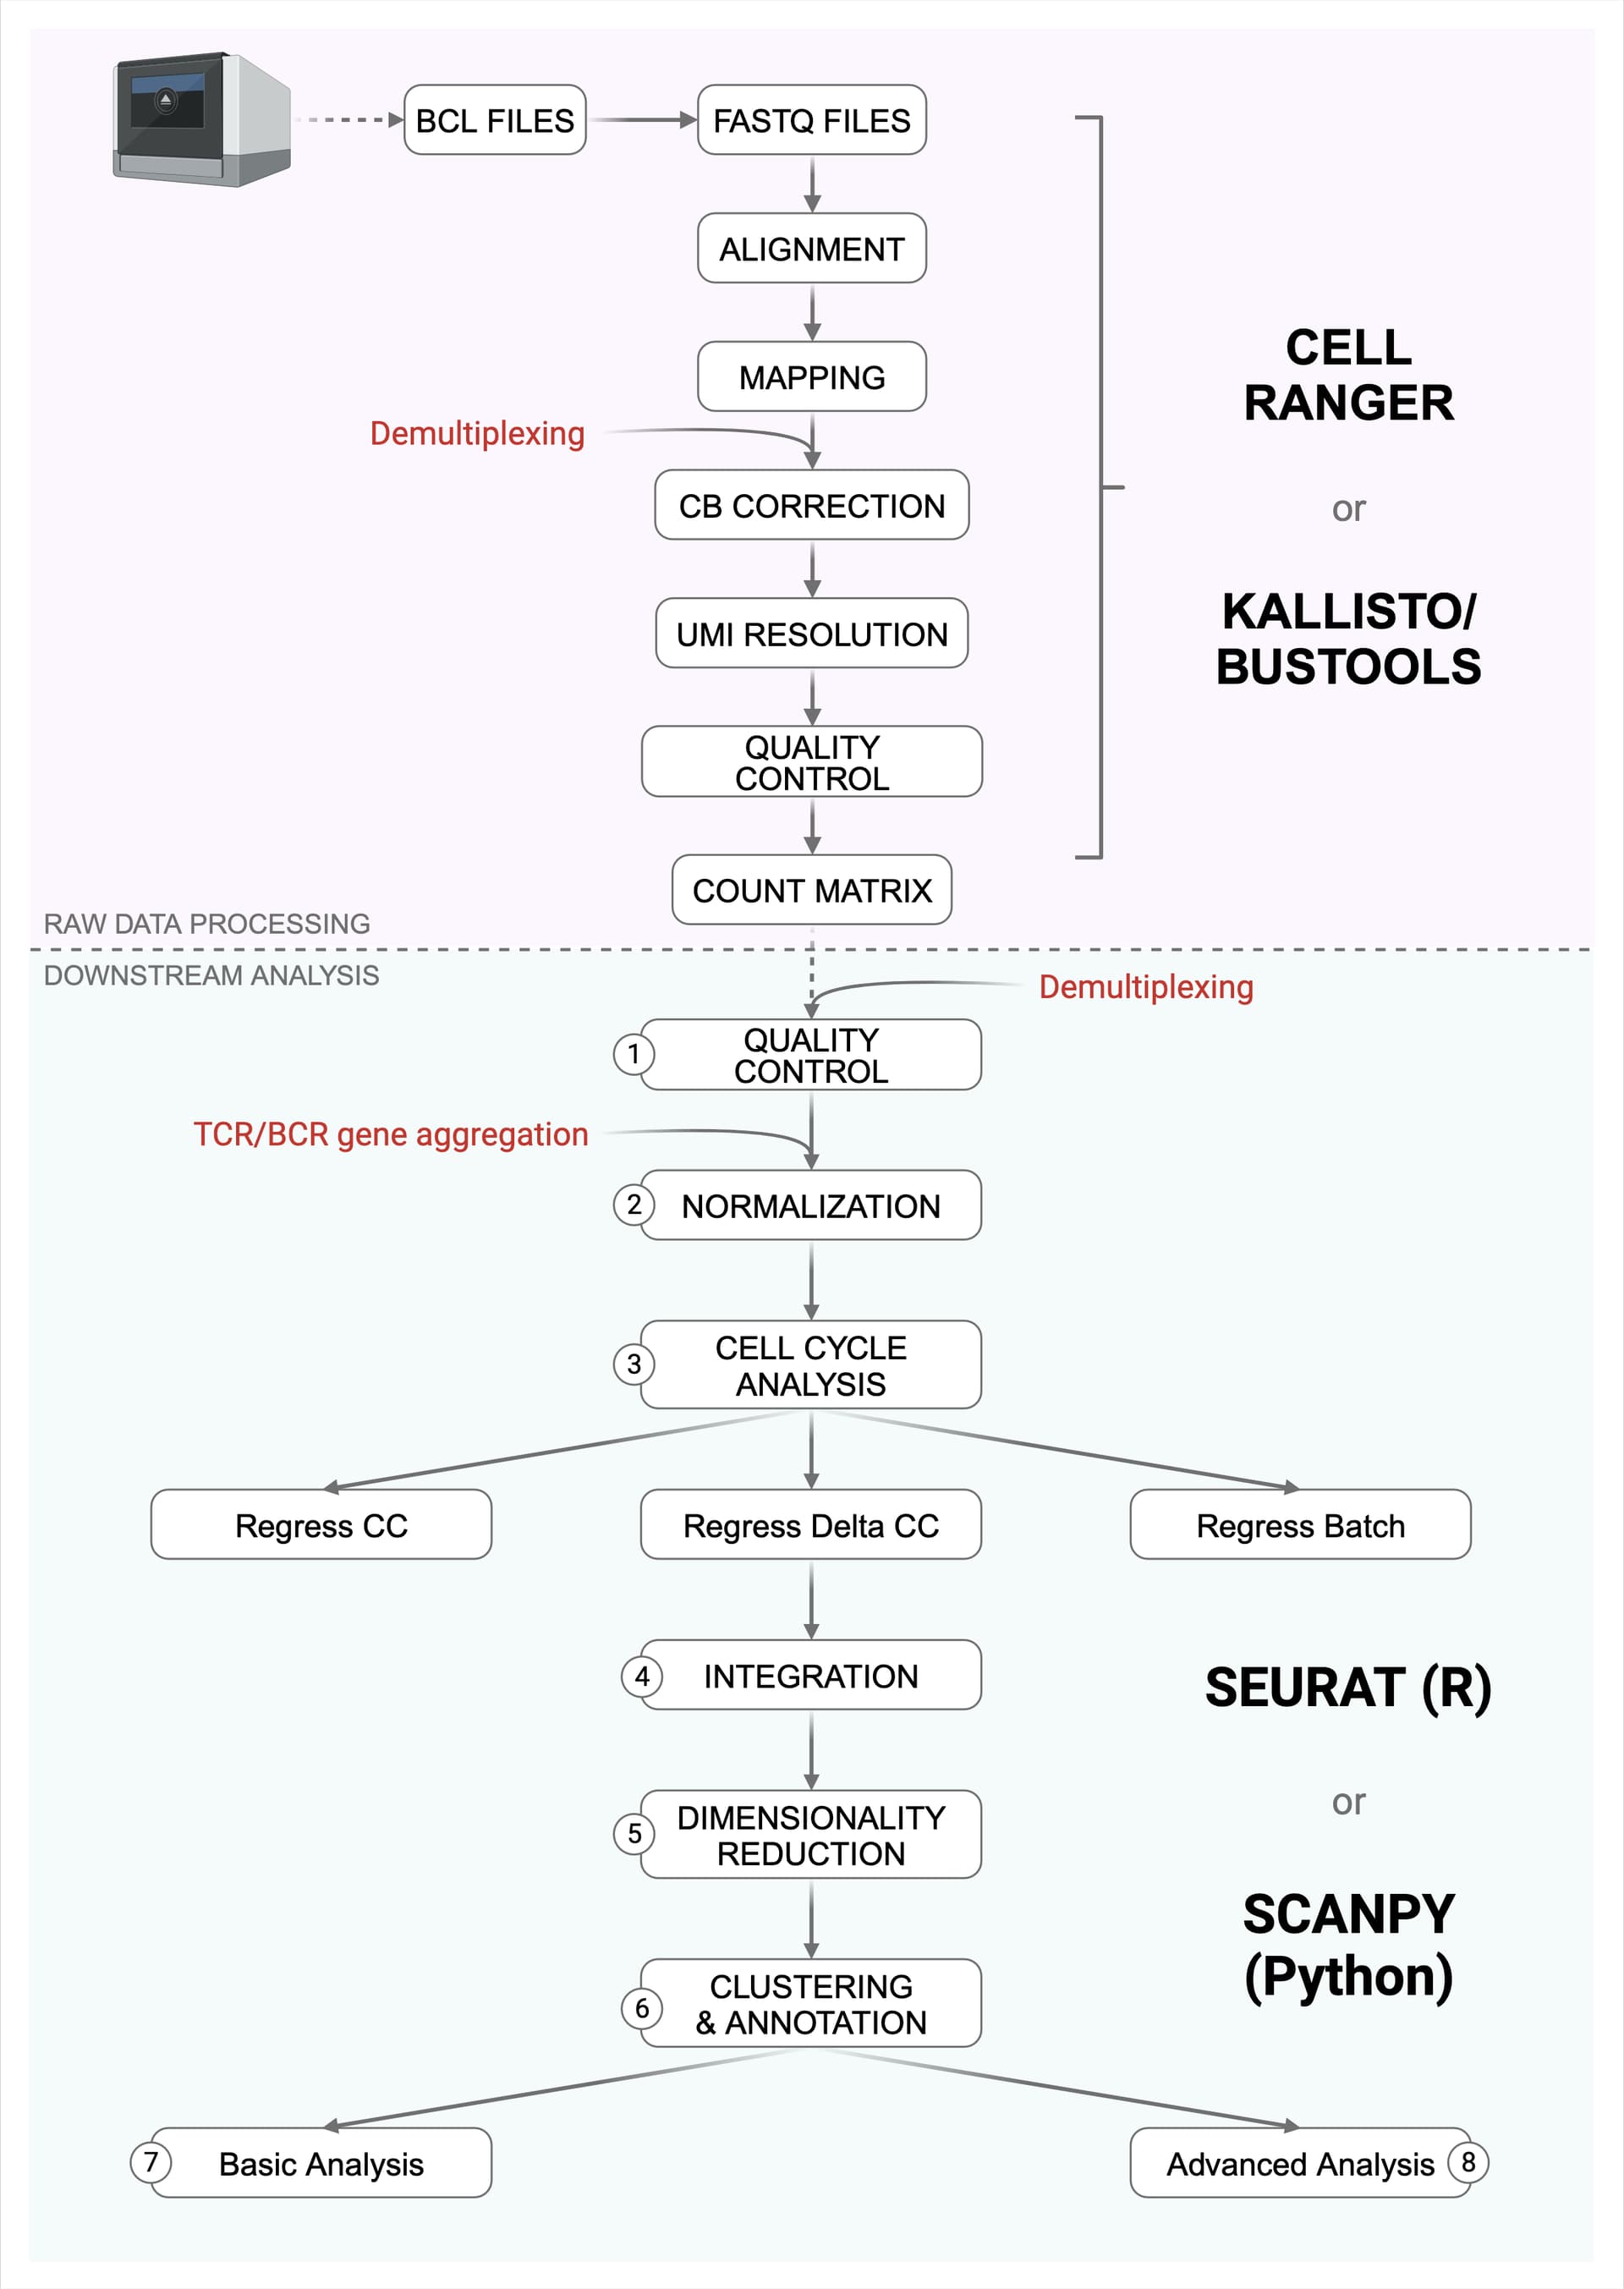
1. Quality Control
Identify single and intact cells based on:
- Number of expressed genes per cell**
Hard threshold, e.g. retain cells with >200 expressed genes
Soft threshold, e.g. retain cells between 5th-99th quantiles based on # of expressed genes - Total UMI counts per cell**
Hard threshold, e.g. retain cells with total counts per cell < 5e4
Soft threshold, e.g. retain cells between 1st-99th quantiles based on # of counts (when sequencing is not as good as expected) - Percent mitochondrial gene reads per cell**
Retain cells with % counts <20% (sometimes less but no higher than 25%) - Percent ribosomal gene reads per cell
- Percent hemoglobin gene reads per cell
Usually retain cells with < 25% hemoglobin gene reads - Doublet/multiplet removal (two or more cells in one droplet)
DoubletFinder (R), Scrublet (Python)
Be careful, there is no perfect solution!
Thresholds for these QC metrics depend highly upon tissue type, cell dissociation method, and library preparation protocol used.
**More commonly used metrics.
2. Normalization
Log-transformation (R/Python)
ScTransform (Seurat - R)
3. Cell cycle analysis
CellCycleScoring (Seurat - R)
Scale or ScTransform (Seurat - R)
4. Integration
Often required when dealing with samples sequenced in different batches, data from different laboratories, data generated from different technologies, and other variations. When it is not clear if batch effect is present, one can use BEER (R) to help (linear correlation below 0.7 indicates the presence of batch effect).
More used integration methods:
- Harmony (R)
- Seurat CCA or RPCA (R)
- Scanorama (Python)
- ScVI (Python)
5. Dimensionality Reduction
Inflection or jack-straw analysis:
- Help with choosing the amount of PCs to use.
6. Clustering and annotation
Manual annotation:
- Based on markers from differential gene expression analysis between clusters
Automated annotation:
- Marker gene-based approaches (requires prior knowledge of marker genes): Azimuth, ScType, scSorter, scCATH, SCINA, CellAssign
- Reference transcriptome-base approaches: SingleR, CHETAH, scmap, scMatch
- Machine learning-based approaches: UCD, Celltypist, Scimilarity, SingleCellNet, scClassify, OnClass, ACTINN, scPred
An alternative for Seurat and scanpy graphical clustering and annotation methods developed by Sims Lab is Multi-Modal Classifier (MMoCHi - Python)
After performing automated annotation, manual curation is advised.
7. Basic Analysis
Differential expression analysis:
- presto::wilcoxauc (R)
- pseudo-bulk with DESeq2 (R)
Gene set enrichment and overrepresentation analysis:
- clusterProfiler (R)
- gprofiler2 (R)
- fgsea (R)
8. Advanced analysis
Trajectory Inference:
- Several R and Python tools (Monocle3 is commonly used)
- Helpful guideline to choose the proper tool: dynverse
- Pseudotime requires prior knowledge of where to root the trajectory, often this information is not known and the analysis is performed in blind (hypothesis testing)
RNA Velocity:
- Pseudotime is based on drawing routes through the UMAP/t-SNE projection based on clustering detection and nearest-neighbor analysis. This is more applicable when one can not establish a root and when is expected that cells are changing relatively rapidly. It allows the user to infer how the cell types vary in rate and probability of transitioning to one another and to calculate the probability of any cell transitioning to another cluster.
- Tools: Velocyto (R / Python), scVelo (Python)
Transcriptional regulatory networks:
Cell-cell communication:
- NicheNet (R)
- CellChat (R)
- CellPhoneDB
VDJ:
- TCR - Scirpy (Python)
- BCR - Dandelion (Python)
- pRESTO (Python)
- Immcantation (Python / R)
Factor Analysis with scHPF (Python): identification of gene signatures (Sims lab)
Aracne TF Network: search for TFs controlling factors identified by scHPF